IELTS Vocabulary: Write a Report
IELTS Writing Task 1 Tip
When a graph or chart appears in IELTS Writing Task 1, it will either compare data at the same point in time or show trends over a period of time. A trend is a general development or a change in a situation.
You should spend about 20 minutes on this task.
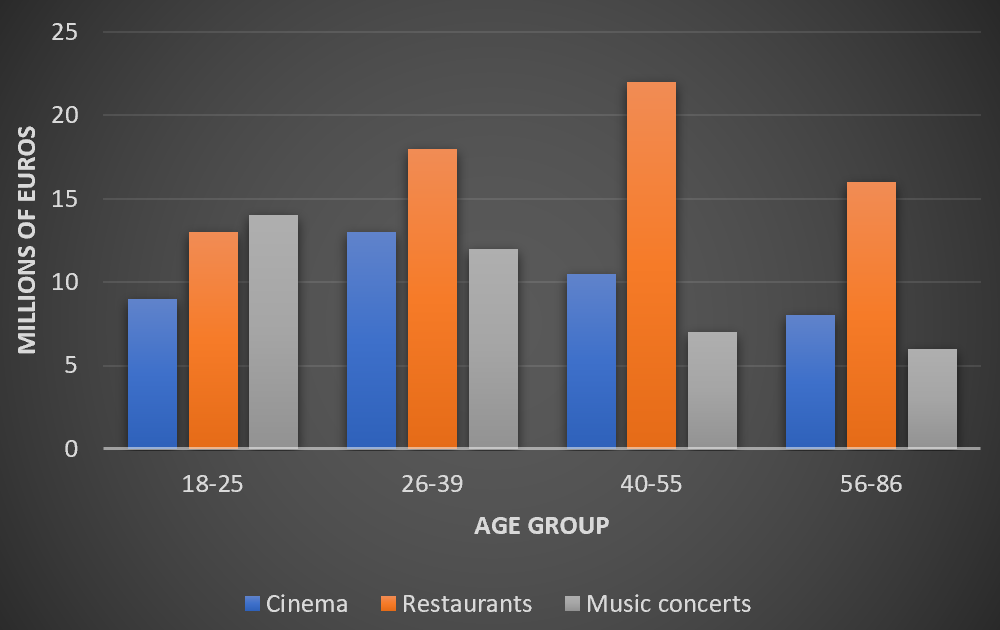
The bar chart compares the amount of money (in millions of euros) that people in four different age groups from Paris, France, spent on going to the cinema, restaurants and music concerts in 2019.
Write at least 150 words.

Choose the correct words to complete the student’s report. Use the words in the box.
The bar chart shows how much Parisians of different age groups spent on seeing movies, eating out and going to concerts in 2019.
Overall, the amount of money was spent on going to restaurants (about €69 million), with going to the cinema (about €40 million) and music concerts (also about €40 million).
The age group spent the most on going to restaurants at about €22 million, while the age group spent the least with only €13 million. With a total of approximately €12 million, the 26−39 category had the highest spending on going to the cinema while the 56−80s spent the least , at around €8 million.