IELTS Vocabulary: Line Graph
IELTS Tip
In IELTS Writing Task 1, you need to decide what information is important. The key information is:
- the main trend
- something which doesn’t follow a trend
- highs, lows and equal points.
Related topic
You should spend about 20 minutes on this task.
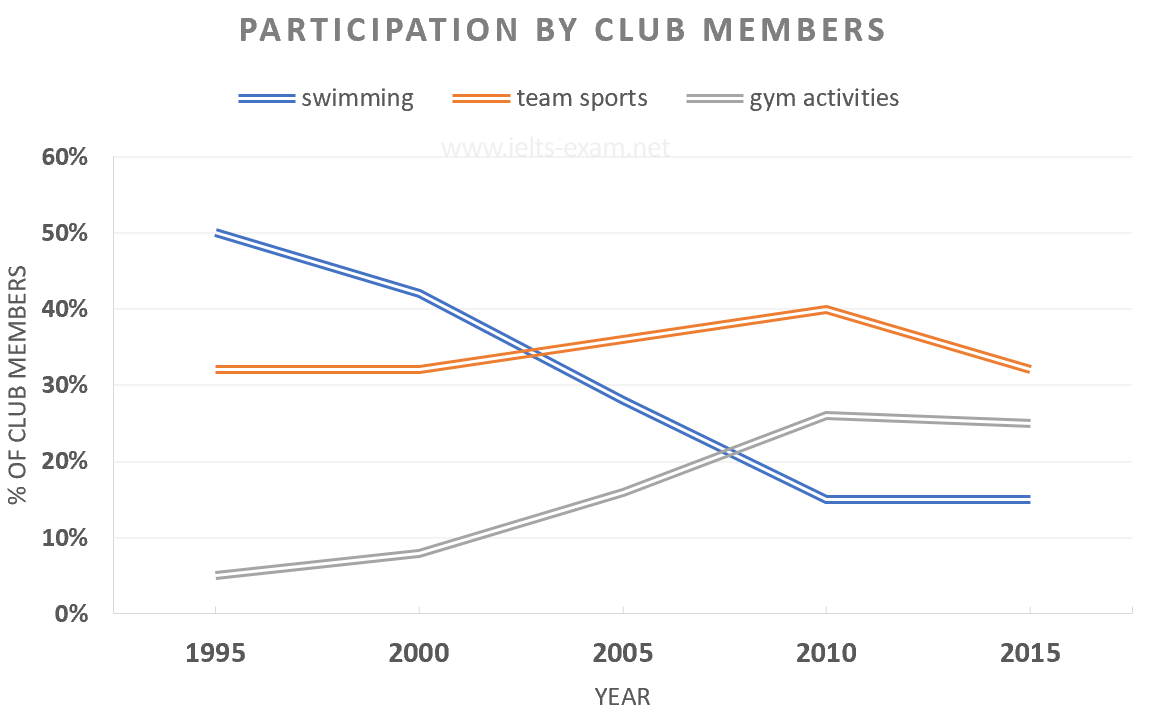
The graph shows the rates of participation in three different activities in a UK sports club between 1995 and 2015.
Summarise the information by selecting and reporting the main features, and make comparisons where relevant.
Write at least 150 words.

Here is a model answer. Choose the answer that best fits each space.
Model answer
This graph shows changes in the popularity of three different activities in a UK sports club over a period of 20 years.
In 1995 around 50% of club members participated in swimming, so this was clearly the most popular activity. However, this figure steadily to 15% in 2010 and at this rate until 2015.
In contrast, 32% of members did team sports in 1995, and this rate 40% in 2010 before to its former level. Participation rates for team sports those for swimming and became the highest for all activities from 2005 to 2015.
Finally, participation in gym activities only 5% in 1995, but this figure rapidly from 2000 to 2010, eventually around 25%, making gym the second most popular activity.
Overall, participation in swimming considerably during the period. Team sports, however, remained popular, while participation in gym activities significantly over the period.