Grammar Exercise #13
IELTS Writing Task 1
When you write a report on a graph or chart for IELTS Writing Task 1, you should try to describe the main features. This means writing about the most important pieces of information on the graph or chart. The main features could be the highest/lowest numbers, the biggest differences, and any similarities.

Look at the graph and read the studentís report. Then complete the report with the correct form of the verbs in brackets.
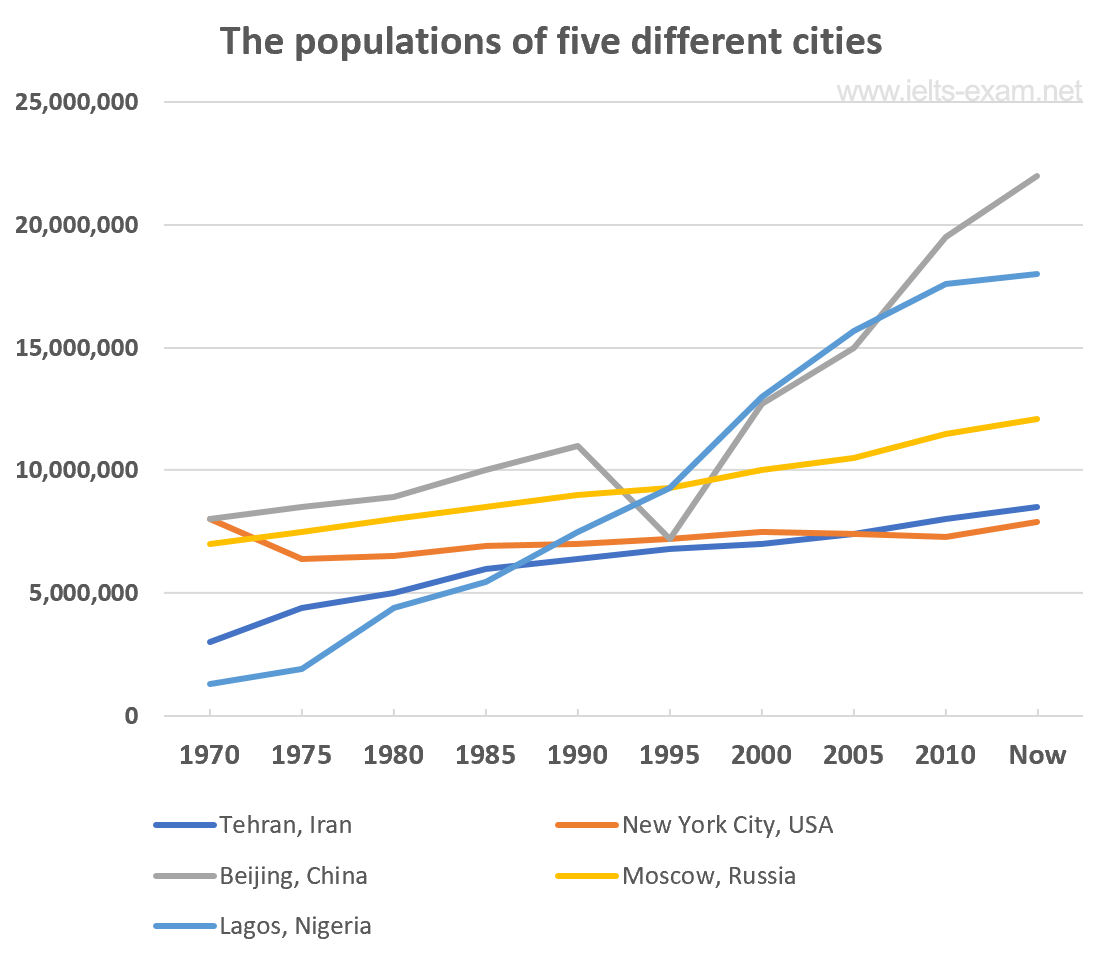
The line graph compares the number of people living in five cities in the world between 1970 and the present.
On the whole, the population of these cities (grow) a lot since 1970. The number of residents in Lagos and Beijing (rise) the most, while the number in Moscow and Tehran (increase) too.
In Lagos, the number ofresidents (rise) from about 1 million in 1970 to 2 million in 1975, but since then the population (grow) quickly from 2 million in 1975 to 18 million at the present time. Similarly, the number of people living in Beijing also (increase) from 8 million in 1970 to just under 20 million in 2010.
By contrast, the population of New York City (stay) the same since 1970. During the 1970s it (fall) from 8 million to about 6.5 million. The number of residents then (remain) at about 7.5 million between 2000 and 2010, and since then it (grow) slowly to around 8 million people at the present time.