IELTS Writing Task 1 #103
Test Tip
In Task 1 of the IELTS Writing modules, you may be asked to describe a graph which shows changes over a period of time. To do this you need to use language expressing change and appropriate tenses. In the exam, make sure you leave time to edit your written answer. You will lose marks if you make too many mistakes in grammar and vocabulary.
You should spend about 20 minutes on this task.
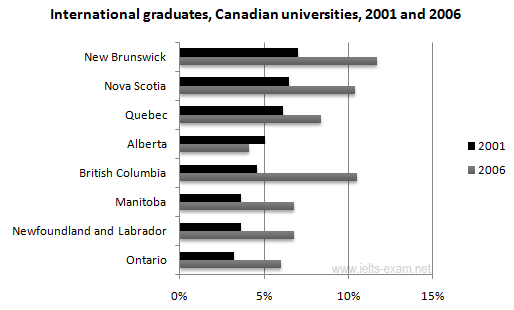
The chart below shows the percentage change in the share of international students among university graduates in different Canadian provinces between 2001 and 2006.
Summarise the information by selecting and reporting the main features, and make comparisons where relevant.
Write at least 150 words.

Source: Statistics Canada, Postsecondary Student Information System
Model answer
The chart shows changes in the share of international students who graduated from universities in different Canadian provinces over a period of 5 years.
In 2001, this share had a relatively narrow range, from 3% in Ontario to 7.0% in New Brunswick. Nova Scotia had the second highest proportion at 6.5%. Five years later, the figures for most provinces had risen, with the exception of Alberta. There, the figures fell by 1% to just over 4%.
By 2006, some parts of Canada experienced a considerable increase in their share of international graduates. Growth in this share was especially strong in the case of New Brunswick, where the figures rose from 7% to 12%. The largest growth occurred in British Columbia, where it more than doubled to 11%.
Over this five-year period, changes in the proportion of international graduates have been very uneven across the provinces of Canada. However, New Brunswick remained the province with the highest percentage overall.
(158 words)