IELTS Writing Task 1 #100
Test Tip
In IELTS Writing Task 1, when you must describe two figures, ask yourself the following:
You should spend about 20 minutes on this task.
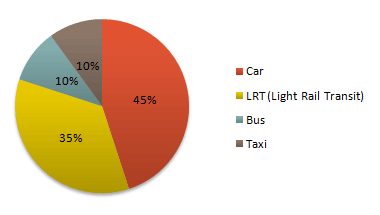
The diagrams below give information on transport and car use in Edmonton.
Summarise the information by selecting and reporting the main features, and make comparisons where relevant.
Write at least 150 words.

People’s reasons for using the car in city
| Commute to work | 55% |
| Shopping | 15% |
| Leisure activities | 15% |
| Taking children to school | 40% |
| Business | 45% |
Model answer
The table shows the reason why people in Edmonton use their cars in the city and the pie chart explains what type of transport people prefer to use most of the time.
Looking at the pie chart first, it is clear that the car is the most popular means of transport in this city. 45% of the people say that they prefer to commute by car. The second most popular form of transport is the LRT, while busses and taxis are the main means of transport for the rest of the people.
The table gives more detailed information about why people use their cars. Surprisingly, 55% of the people need to commute to work by car. Cars are also used a lot for taking children to school or business purposes. Only 15% of drivers are doing their shopping and, similarly, 15% need to travel by car for leisure.
Overall, people in Edmonton make good use of alternative methods of transport but there is a heavy dependence on cars for work.
(170 words)