IELTS Writing Task 1 #93
Test Tip
In IELTS Writing Task 1, you do not need to describe all the information given. To summarise, you must select the main features from what is shown. Information is often given in the form of a graph, a chart, or a table. Read any headings, key and sources for the data to understand what it relates to. The data may show differences or changes over time, between places, or between groups of people. Try to identify significant contrasts, similarities, or trends.
You should spend about 20 minutes on this task.
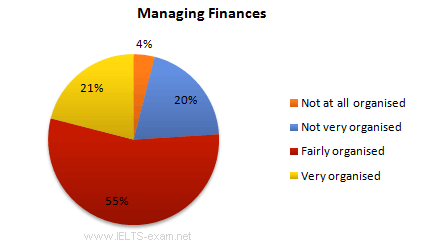
The diagrams below show UK students' responses to the question of to what extent would they describe themselves as financially organised.
Summarise the information by selecting and reporting the main features, and make comparisons where relevant.
Write at least 150 words.

| Very organised % | |
| All students | 21 |
| Age up to 22 years | 18 |
| Age 23-25 years | 26 |
| Age over 26 years | 35 |
Source: http://www.unite-group.co.uk/binaries/MungoBlobs-1350377092294.pdf
Model answer
The two diagrams show students' responses to the question of how good they are at managing their finances. The pie chart illustrates the ability of UK students to manage their finances and the table shows the proportion of students, by age, who think they are very organised at managing their finances.
More than three-quarters of students (76%) believe they are either ‘very’ or ‘fairly’ organised financially, while one in five (20%) say they are not very organised in this area. Only 4% of students rate themselves as ‘not at all’ competent.
The ability to manage one’s finances well would seem to develop with age and experience as older students are almost twice as likely to say they are ‘very’ organised than younger ones (31% of students aged 26 or over compared to just 17% for those aged up to 22).
Overall, the findings suggest that students generally manage their finances well.
(151 words)