IELTS Writing Task 1 #201
IELTS Writing Tip
A range of different diagrams may be used in IELTS Writing Task 1. Practise 'reading' diagrams that lay out information in different ways by exploring the chart wizard on your computer. Use different ways of expressing figures to increase your vocabulary score. Similarly, repeating language will reduce the vocabulary score!
You should spend about 20 minutes on this task.
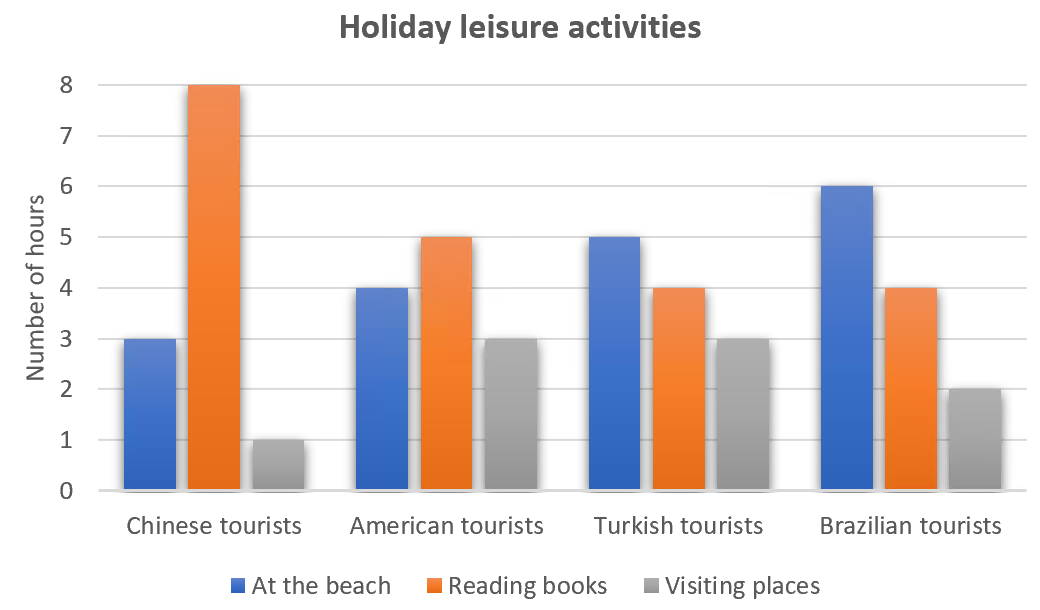
The chart shows the average number of hours each day that Chinese, American, Turkish and Brazilian tourists spent doing leisure activities while on holiday in Greece in August 2019.
Summarise the information by selecting and reporting the main features and make comparisons where relevant.
Write at least 150 words.

Model answer
The bar chart compares the amount of time each day that people from four different countries spent doing activities while on holiday in Greece in August 2019. The activities were going to the beach, visiting different attractions, and reading.
Overall, the tourists spent the most time reading books while they spent the least time visiting places. The Chinese tourists spent the longest reading books with a total of eight hours per day. By contrast, the Brazilians spent the longest at the beach with a total of six hours.
Both the American and the Turkish tourists spent the same number of hours every day visiting places with a total of three hours each. Similarly, the Turkish and Brazilian groups spent a total of four hours each reading books. The Chinese tourists spent twice the amount of time reading books as the Turkish and Brazilian tourists, whereas the American and Turkish groups spent three times the amount of time visiting places as the Chinese group.
(163 words)