IELTS Writing Task 1 #186
Tip for IELTS Academic Writing Task 1
In IELTS Academic Writing Task 1 you have to select and compare relevant information from data presented in a graph, table or diagram. In your introduction, do not copy the text from the question. Use your own words. You shouldn't try to interpret or give reasons for the data; keep your response factual.
You should spend about 20 minutes on this task.
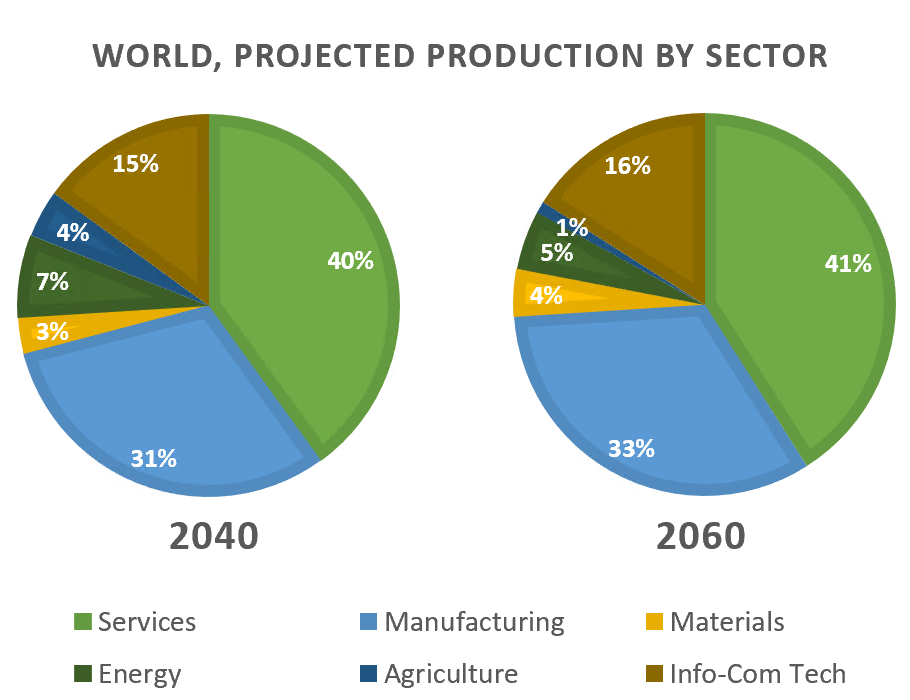
The charts show projections for global production by sector in 2040 and 2060.
Summarise the information by selecting and reporting the main features, and make comparisons where relevant.
Write at least 150 words.

Model answer
The charts show projections for global production by sector in 2040 and 2060. Generally speaking, there is little change in the projected proportion of production by the various sectors in the two years, with manufacturing and services being the most dominant.
It is forecast that the services and manufacturing sectors together will account for more than half of global production in 2040 and 2060, 71% (40% and 31%) and 74% (41% and 33%) respectively. By contrast, the proportion of production from energy is expected to decline from 7% in 2040 to 5% in 2060, a drop of approximately one third. It is also anticipated that there will be a similar dramatic drop for agriculture production from 4% to 1% with production in materials, by contrast, comprising 4% in 2060 compared to 3% in 2040.
As regards info-communications and technology, there is expected to be little difference in the proportion of production the sector constitutes, with a slight rise from 15% to 16% over the period.
(165 words)